ggplot2::ggplot(iris, ggplot2::aes(x = Sepal.Length,
y = Petal.Length,
color = Species)) +
ggplot2::geom_point()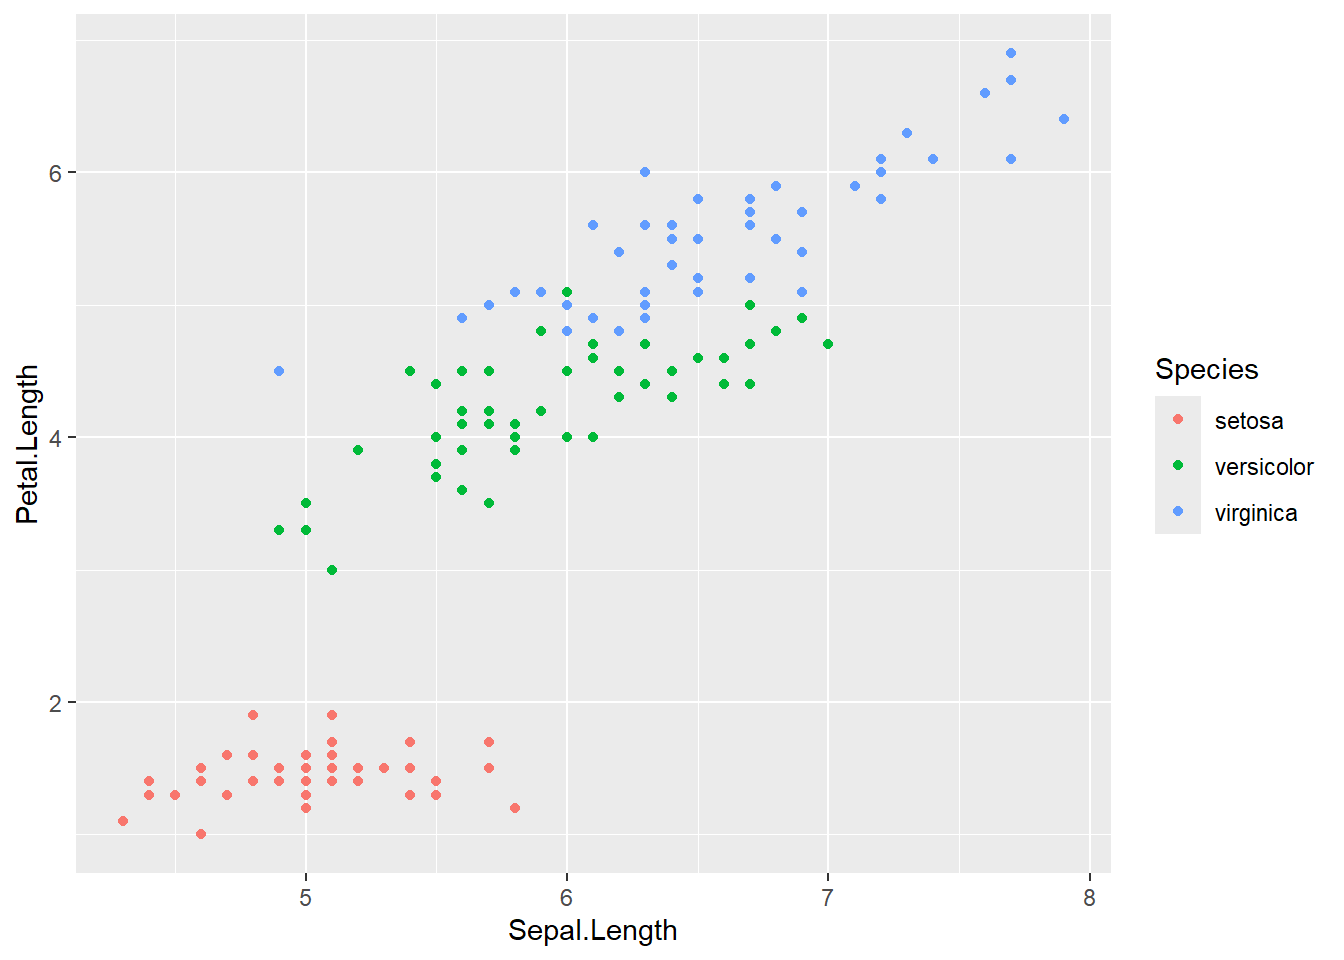
It’s typically nicest to work with Quarto rendered to html. But sometimes we need other formats (collaborators, publishing, etc). We can render to different formats individually (e.g. word), but we can also produce multiple formats from the same qmd.
This multi-render is really nice, in that it provides the html with a link to download the others (word, pdf, etc- see top right of this page). It’s very close to the new Manuscripts project type that is coming in Quarto 1.4, though that keeps breaking for me. As an example, this (the header for this file) will produce an html, docx, and pdf, with links to the docx and pdf files at the top right.
format:
  html:
    toc: true
    comments:
      hypothesis: true
  docx:
    toc: true
    toc-depth: 2
    prefer-html: true
    # setting these to the html defaults so they don't get jumbled between format
    fig-width: 7
    fig-height: 5
  pdf:
    toc: true
    colorlinks: true
A nice thing about this approach is that it lets a single page on a website have downloadable word/pdf files, whereas I couldn’t get the manuscript to work as a subset of a website (though I didn’t try very hard). Manuscripts do look like they’ll be nicer for author info and formatting, but I kept breaking the development version, so I’ll try that again later.
If working in Rstudio, this also lets us click the arrow next to the render button to choose which format to use for a manual render.
I’ve also turned on Hypothes.is comments for this page, dealt with in more detail elsewhere. The short story is you can make annotations and highlights on this page, which can be public or private, depending on your settings.
Just to make that fancier across outputs, I’ll throw a figure on and maybe some math
\[ f(x) = \frac{1}{\sigma\sqrt(2\pi)}e^{-\frac{1}{2}\left(\frac{x-\mu}{\sigma}\right)^2} \]
ggplot2::ggplot(iris, ggplot2::aes(x = Sepal.Length,
                                   y = Petal.Length,
                                   color = Species)) +
  ggplot2::geom_point()