library(ggplot2)Reference sections
1 Bibliography style
Use a csl file to change the referencing style, both in-text and in-bib. Put
csl: ecology.cslin the header to use a different file. Get CSL files from their github, and look at what they actually look like from CSL’s visual editor (which seems to kick over to something managed by Zotero.
2 References (bibliography)
To put the bibliography wherever you want, include a div ::: {#refs} wherever you want it to be. If we cite Holt and Chesson (2018), we can put the bib right here.
Note, we need square brackets around the citation to get the author in parentheses. This one has square brackets (Holt and Chesson 2018) and this one Holt and Chesson (2018) does not.
3 Figures and tables with sections
I want to have figs and tables in different sections; e.g. in main text and supplement or different chapters. It seems to work different for figs generated from code and images loaded in.
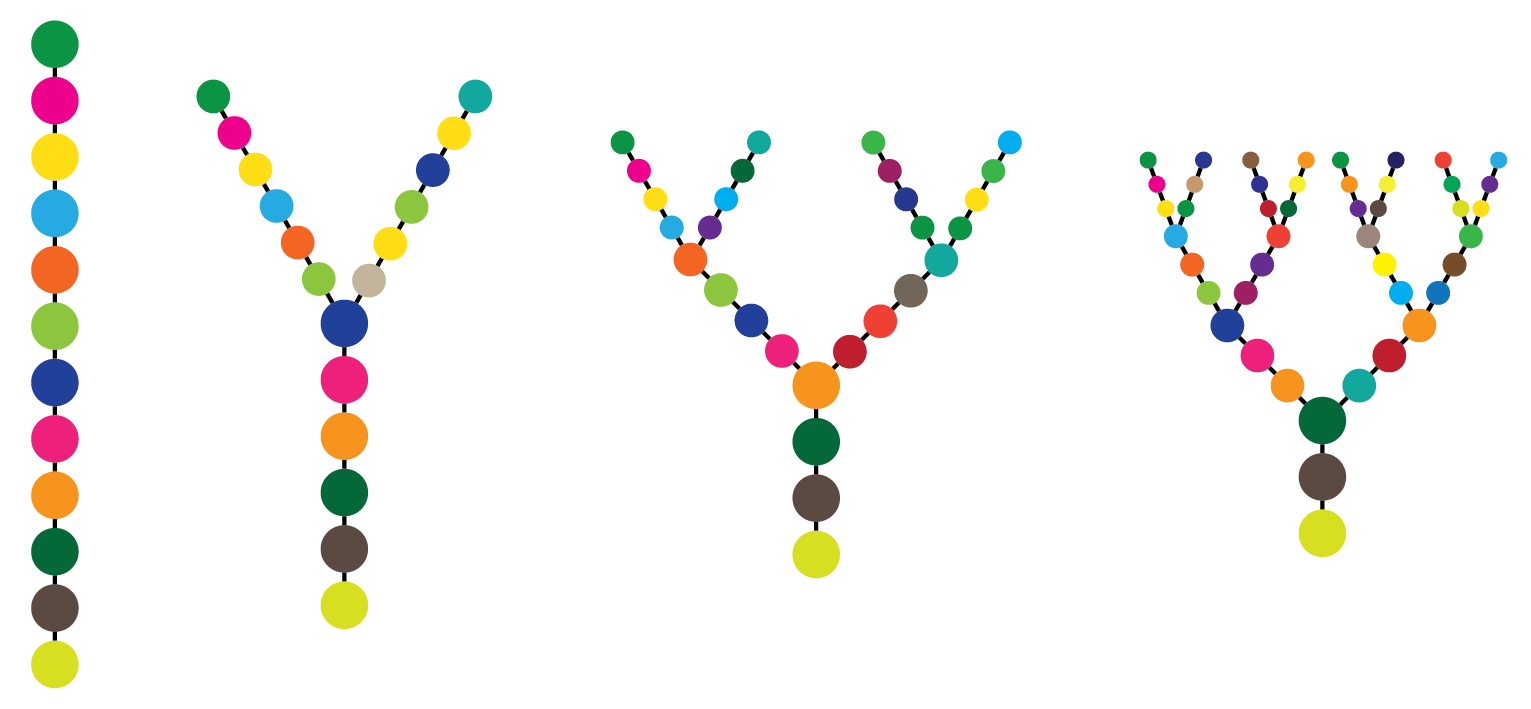
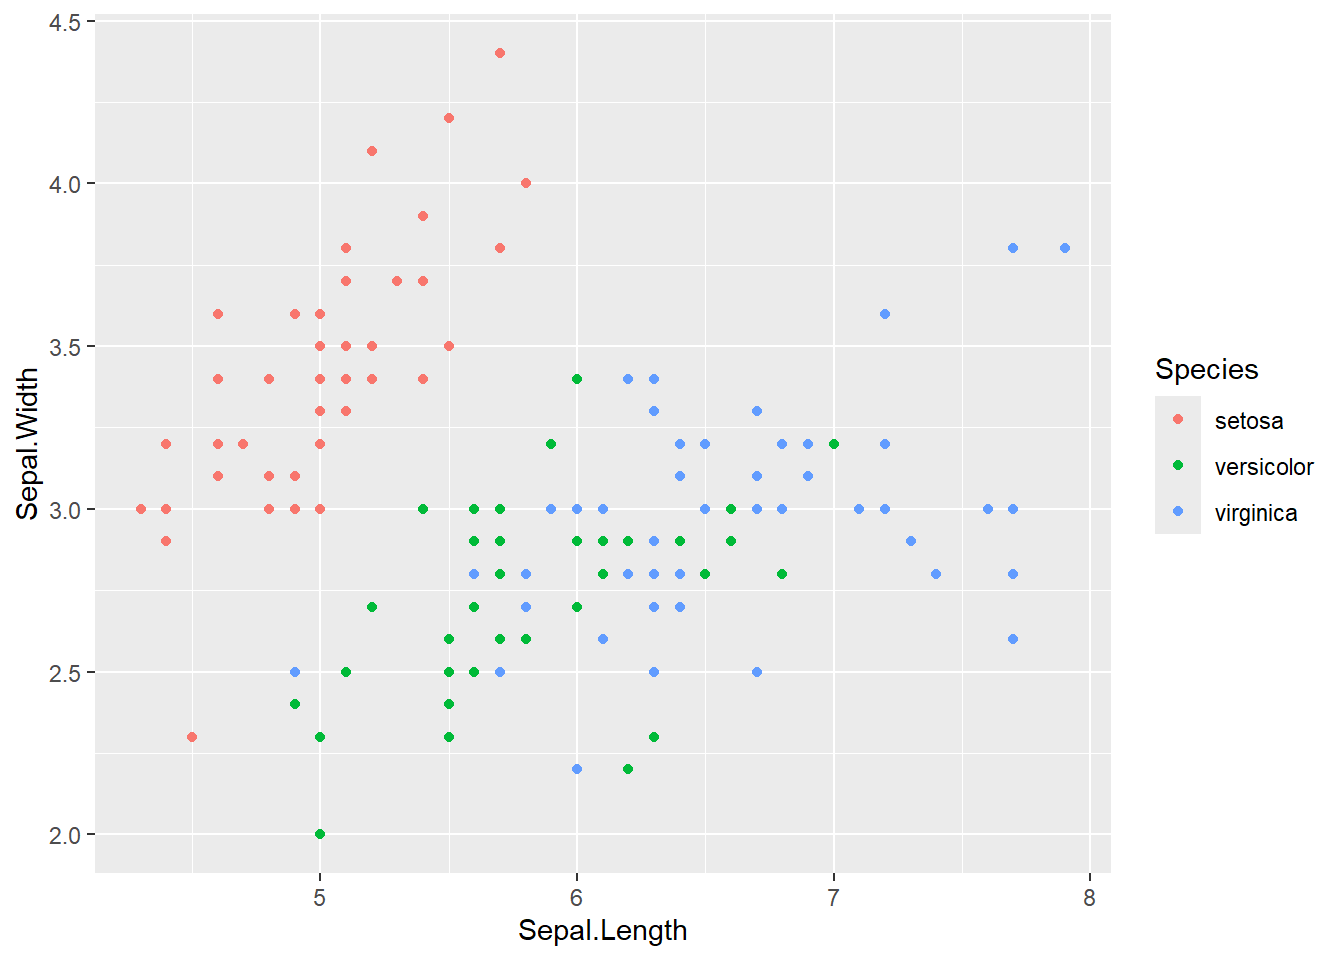
In the main text, we just use tbl and fig, referenced with @tbl-iris (Table 1) for tables, @fig-branching (Figure 1) for read-in images, and @fig-iris (Figure 2) for code-generated figures:
```{r}
#| label: tbl-iris
#| tbl-cap: Head of iris dataframe
head(iris) |> knitr::kable()
```| Sepal.Length | Sepal.Width | Petal.Length | Petal.Width | Species |
|---|---|---|---|---|
| 5.1 | 3.5 | 1.4 | 0.2 | setosa |
| 4.9 | 3.0 | 1.4 | 0.2 | setosa |
| 4.7 | 3.2 | 1.3 | 0.2 | setosa |
| 4.6 | 3.1 | 1.5 | 0.2 | setosa |
| 5.0 | 3.6 | 1.4 | 0.2 | setosa |
| 5.4 | 3.9 | 1.7 | 0.4 | setosa |
{#fig-branching} gives

```{r}
#| label: fig-iris
#| fig-cap: A figure of the iris dataframe

ggplot(iris, aes(x = Sepal.Length, y = Sepal.Width, color = Species)) +
  geom_point()
```
4 New section
Now, according to the Quarto docs, we can add a new kind of crossref. So I’ve put the following from that site in the yaml header:
crossref:
  custom:
    - kind: float
      key: suppfig
      latex-env: suppfig
      reference-prefix: Figure S
      space-before-numbering: false
    - kind: float
      key: supptbl
      latex-env: supptbl
      reference-prefix: Table S
      space-before-numbering: false
      caption-location: top
See docs for options.
Now, the trick, which I missed, is that it only works for fenced divs (see github issues). See quarto docs.
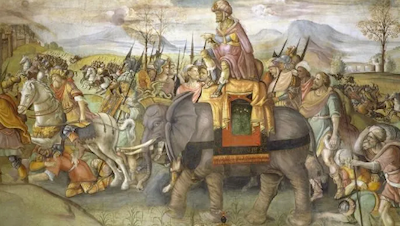
Now, it should work to use suppfig to reference loaded figures such as @suppfig-elephant (Figure S1) for read-in images, and @suppfig-iris (Figure S2) for code-generated figures and tables @supptbl-iris (Table S1) Only if we use divs:
{#suppfig-elephant} gives

Wapping this in ::: {#suppfig-iris} and putting the caption inside:
```{r}
ggplot(iris, aes(x = Sepal.Length, y = Sepal.Width, color = Petal.Width)) +
  geom_point()
```
Now tables. It captions at the bottom though unles we set caption-location: top in the yml.
```{r}
tail(iris) |> knitr::kable()
```| Sepal.Length | Sepal.Width | Petal.Length | Petal.Width | Species | |
|---|---|---|---|---|---|
| 145 | 6.7 | 3.3 | 5.7 | 2.5 | virginica |
| 146 | 6.7 | 3.0 | 5.2 | 2.3 | virginica |
| 147 | 6.3 | 2.5 | 5.0 | 1.9 | virginica |
| 148 | 6.5 | 3.0 | 5.2 | 2.0 | virginica |
| 149 | 6.2 | 3.4 | 5.4 | 2.3 | virginica |
| 150 | 5.9 | 3.0 | 5.1 | 1.8 | virginica |
Unnumbered sections
If we have number-sections: true in the yaml, we can turn it off for some by putting {.unnumbered} next to their names (as I have for this section).