library(dplyr)
library(colorspace)
library(ggplot2)RGB to hex
Let’s say we have a dataframe with R, G, B values, but we want the hex. Why? Maybe we want to use scale_color_identity to plot the values in some other columns. Let’s say x and y.
set.seed(17)
rgbtib <- tidyr::expand_grid(x = 1:10, y = 1:10) %>%
  mutate(R = sample(0:255, 100),
                         G = sample(0:255, 100),
                         B = sample(0:255, 100))
rgbtib
# A tibble: 100 × 5
x y R G B
<int> <int> <int> <int> <int>
1 1 1 177 166 44
2 1 2 231 80 48
3 1 3 224 188 136
4 1 4 221 168 181
5 1 5 107 82 93
6 1 6 238 111 179
7 1 7 246 242 124
8 1 8 230 57 213
9 1 9 172 151 130
10 1 10 166 93 84
# ℹ 90 more rowsWe can use {colorspace}, but it’s convoluted- have to make an RGB object first, and then convert to hex. And the RGB need to be on 0-1, not 0-255.
Writing that out doesn’t work because the colorspace RGB object can’t get stuffed in the dataframe. But this is the idea
rgbtib_writeout <- rgbtib %>%
  # Convert to 0-1
  mutate(across(all_of(c('R', 'G', 'B')), ~./255)) %>%
  # Create the rgb object
  mutate(rgbobj = colorspace::RGB(R, G, B)) %>%
  # Get the hex values
  mutate(hexval = colorspace::hex(rgbobj))
So, make a function. Have a maxval the user can pass (don’t assume it’s 1 or 255).
rgb2hex <- function(R, G, B, maxval = 255) {
  rgbobj <- colorspace::RGB(R/maxval, G/maxval, B/maxval)
  hexval <- colorspace::hex(rgbobj)
  return(hexval)
}
Test that
rgb2hex(177, 41, 147)[1] "#D970C8"apparently quarto doesn’t do the cool printing of color thing in output, just input.
"#D970C8"[1] "#D970C8"Now, use that in the mutate
rgbtib <- rgbtib %>%
  mutate(hexvals = rgb2hex(R, G, B))
rgbtib
# A tibble: 100 × 6
x y R G B hexvals
<int> <int> <int> <int> <int> <chr>
1 1 1 177 166 44 #D9D373
2 1 2 231 80 48 #F49878
3 1 3 224 188 136 #F1DFC1
4 1 4 221 168 181 #EFD4DB
5 1 5 107 82 93 #AD9AA3
6 1 6 238 111 179 #F7B0DA
7 1 7 246 242 124 #FBF9B9
8 1 8 230 57 213 #F482EC
9 1 9 172 151 130 #D6CABD
10 1 10 166 93 84 #D3A39B
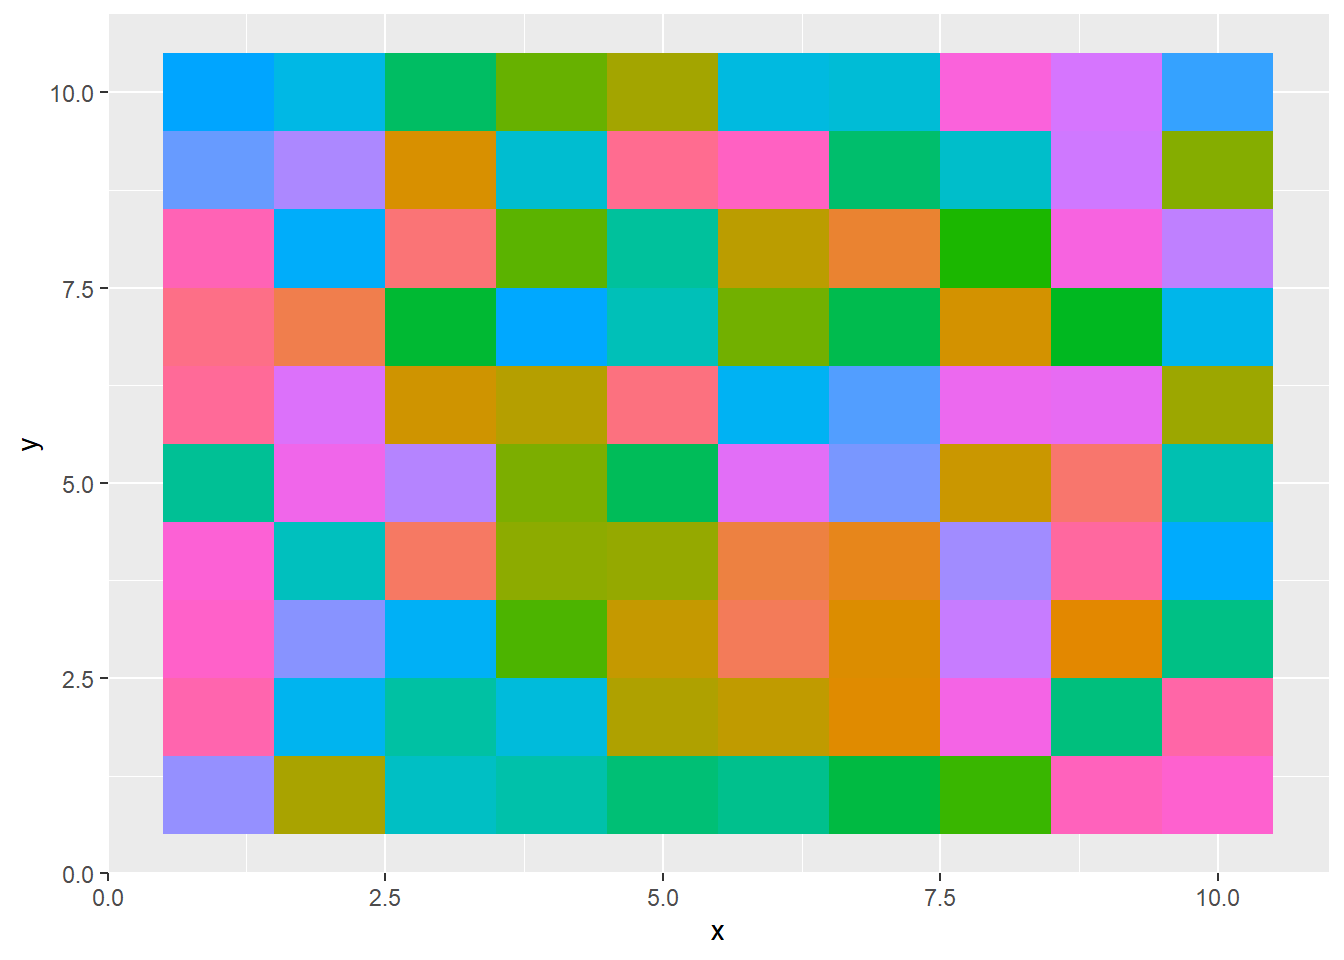
# ℹ 90 more rowsPlot to show it works
ggplot(rgbtib, aes(x = x, y = y, fill = hexvals)) + geom_tile() + theme(legend.position = 'none')