The fetch_kiwis_timeseries() function wraps
find_ts_id() (which itself wraps
getTimeseriesList()) and
getTimeseriesValues(), which allows some extra
functionality and smoother workflows but also introduces some danger.
Unlike fetch_hydstra_timeseries(), though,
fetch_kiwis_timeseries() tends to increase efficiency of
the API requests. Some argument names have been changed compared to
getTimeseriesValues() (which gives the user full access to
KiWIS names) for more clarity and to move towards a unified interface
across both API styles.
Period of record
This function is most useful when we want to pull the period of
record of the same variable for a set of gauges, especially if we want
to choose that variable by name and not ts_id code. For
example, we might want to pull discharge for the period of record. We
would define the period of record by passing 'all' to
start_time and end_time, or
period = 'complete'. We can choose daily mean discharge in
ML/d with variable = 'discharge',
units = 'ML/d', and statistic = 'mean',
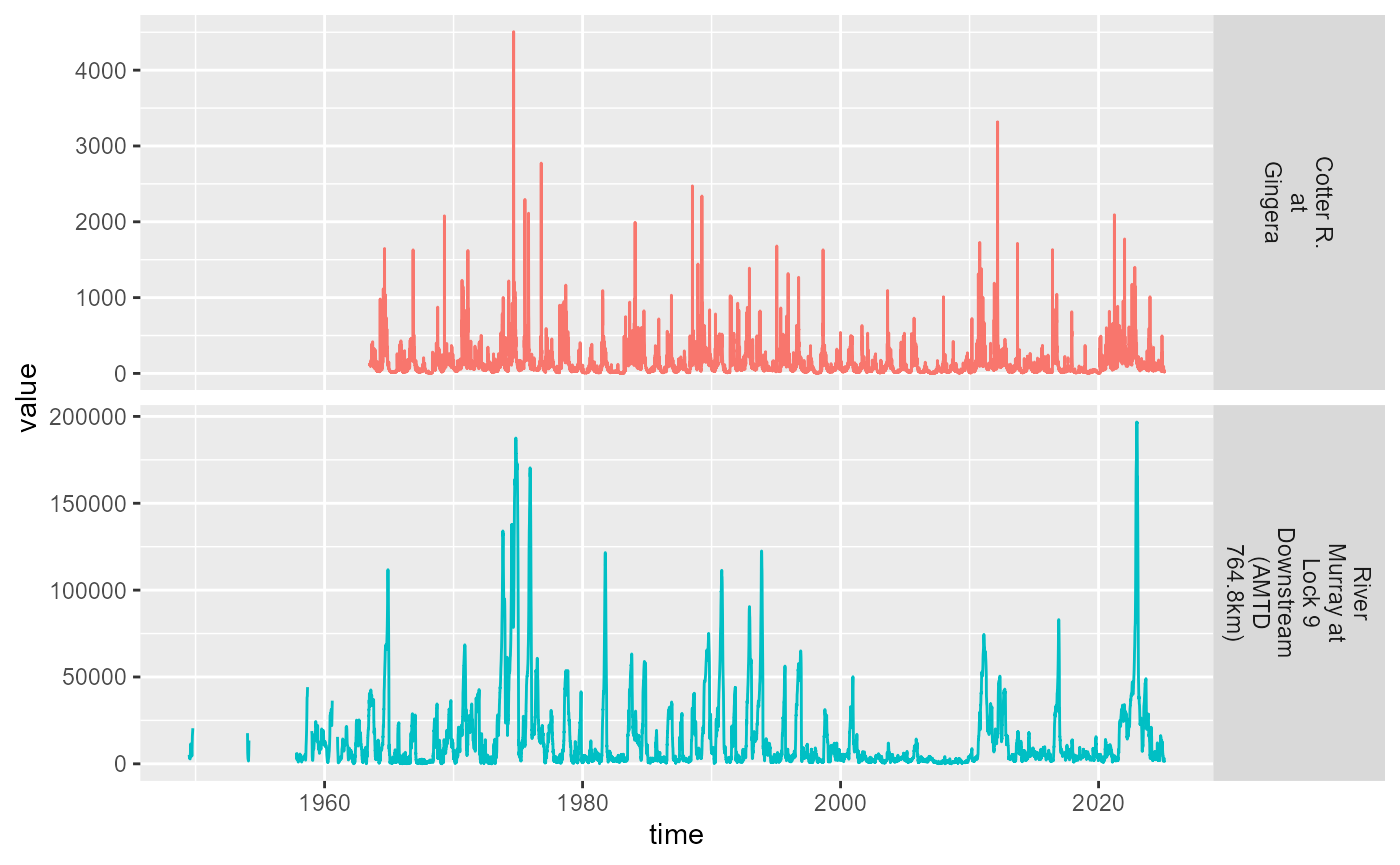
yielding @ref(fig:discharge-period).
Choosing the ts_id codes from variable,
units, statistic and datatype
uses regex in find_ts_id(), and is not guaranteed to yield
one and only one result. This can be handy, in that we can use
wildcards, but also can lead to extra data sneaking in (e.g. 9am and
midnight daily start times). Check your data carefully for extra
variables or duplication. For large calls, it is a good idea to run
find_ts_id() manually and check the output has no surprises
before pulling the timeseries.
discharge_record <- fetch_kiwis_timeseries(portal = 'bom',
                                           gauge = c('410730', 'A4260505'),
                                           period = 'complete',
                                           variable = 'discharge',
                                           units = 'ML/d',
                                           timeunit = 'Daily',
                                           statistic = 'mean',
                                           datatype = 'QaQc')
#> Loading required package: foreach
#> Loading required package: future
discharge_record |>
  ggplot(aes(x = time, y = value, color = station_name)) +
  geom_line()  +
  facet_grid(station_name ~ ., scales = 'free', labeller = label_wrap_gen(10)) +
  theme(legend.position = 'none')
#> Warning: Removed 3 rows containing missing values or values outside the scale range
#> (`geom_line()`).
Discharge for the period of record for three gauges.
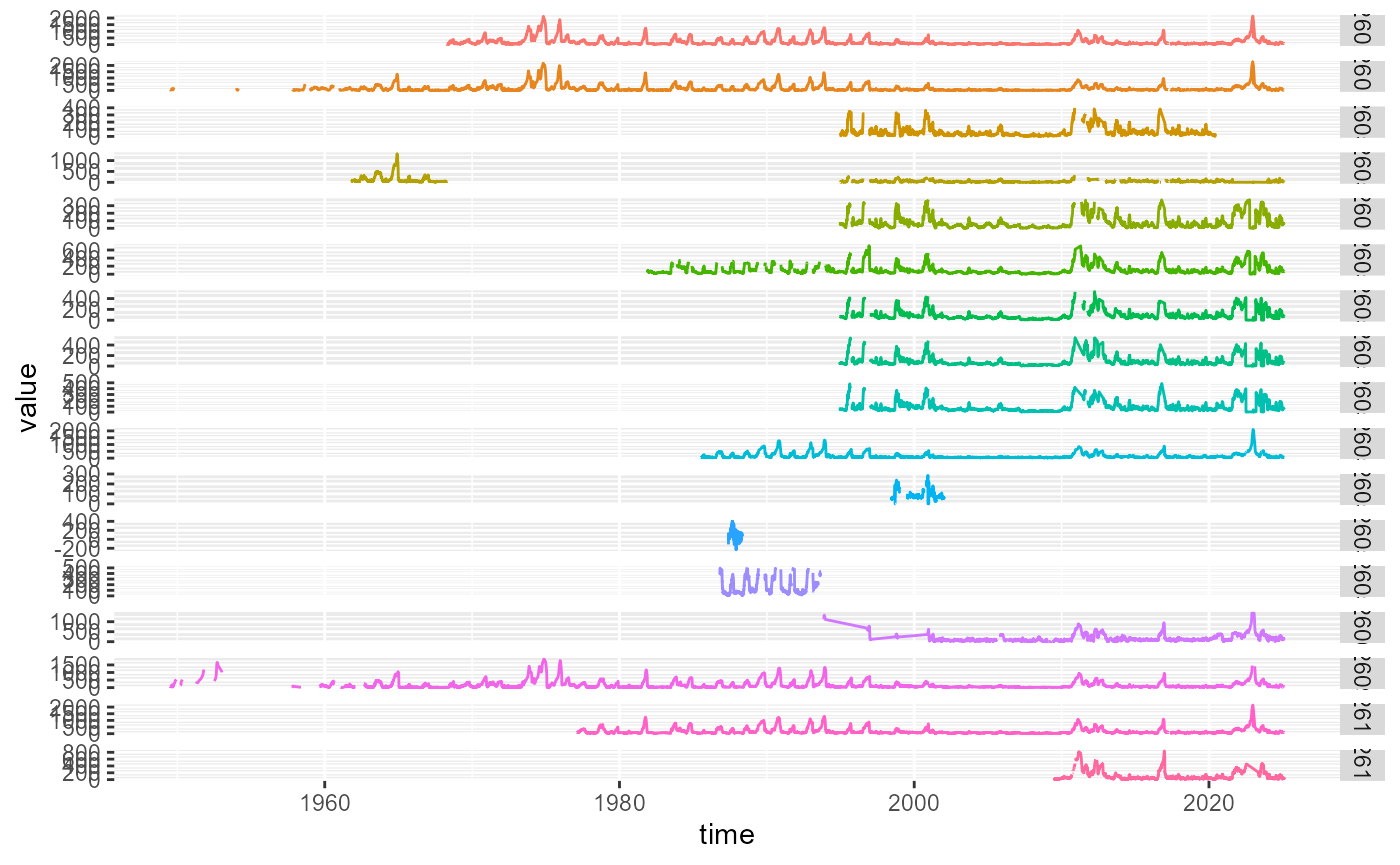
The use of extra_list lets us use regex to select
gauges, as well as pre-select some of the desired data by limiting what
gets returned by find_ts_id() (the ’*24HR’ limits which daily start we
use). Many of these only report cumecs, not ML/d.
murray_discharge <- fetch_kiwis_timeseries(portal = 'bom',
                                           extra_list = list(station_name = 'River Murray*',
                                                             ts_name = '*24HR'),
                                           period = 'complete',
                                           variable = 'discharge',
                                           units = 'cumec',
                                           timeunit = 'Daily',
                                           statistic = 'mean',
                                           datatype = 'QaQc')
murray_discharge |>
  ggplot(aes(x = time, y = value, color = station_no)) +
  geom_line()  +
  facet_grid(station_no ~ ., scales = 'free', labeller = label_wrap_gen(10)) +
  theme(legend.position = 'none')
#> Warning: Removed 34 rows containing missing values or values outside the scale range
#> (`geom_line()`).
Discharge for the period of record for all gauges starting with ‘River Murray’.
Multiple variables
Unlike fetch_hydstra_timeseries(), we don’t need to
worry about misaggregating different variables here, because each
aggregation has its own ts_id. On the other hand, because
the selection of ts_ids uses regex OR, we can’t use matched vectors here
to get different aggregations for different variables (though that may
happen if an aggregation isn’t available for some variables, e.g. daily
mean rainfall).
Instead, we pass in the regex, let it choose with OR, and check the output very carefully, potentially deleting unwanted data. Or make separate calls, which will tend to be safer. This OR pattern can be useful for more than variables as well, allowing us to choose multiple time periods or
multi_ts <- fetch_kiwis_timeseries(portal = 'bom',
                                   gauge = c('410730', 'A4260505'),
                                   variable = c('discharge', 'Rainfall'),
                                   units = c('cumec', 'mm'),
                                   timeunit = c('Daily', 'Monthly'),
                                   statistic = c('Mean', 'Total'),
                                   datatype = c('QaQc'),
                                   # If I want monthly to return, need to cross a month boundary.
                                   start_time = '2019-12-01 01:30:30',
                                   end_time = '20201231')
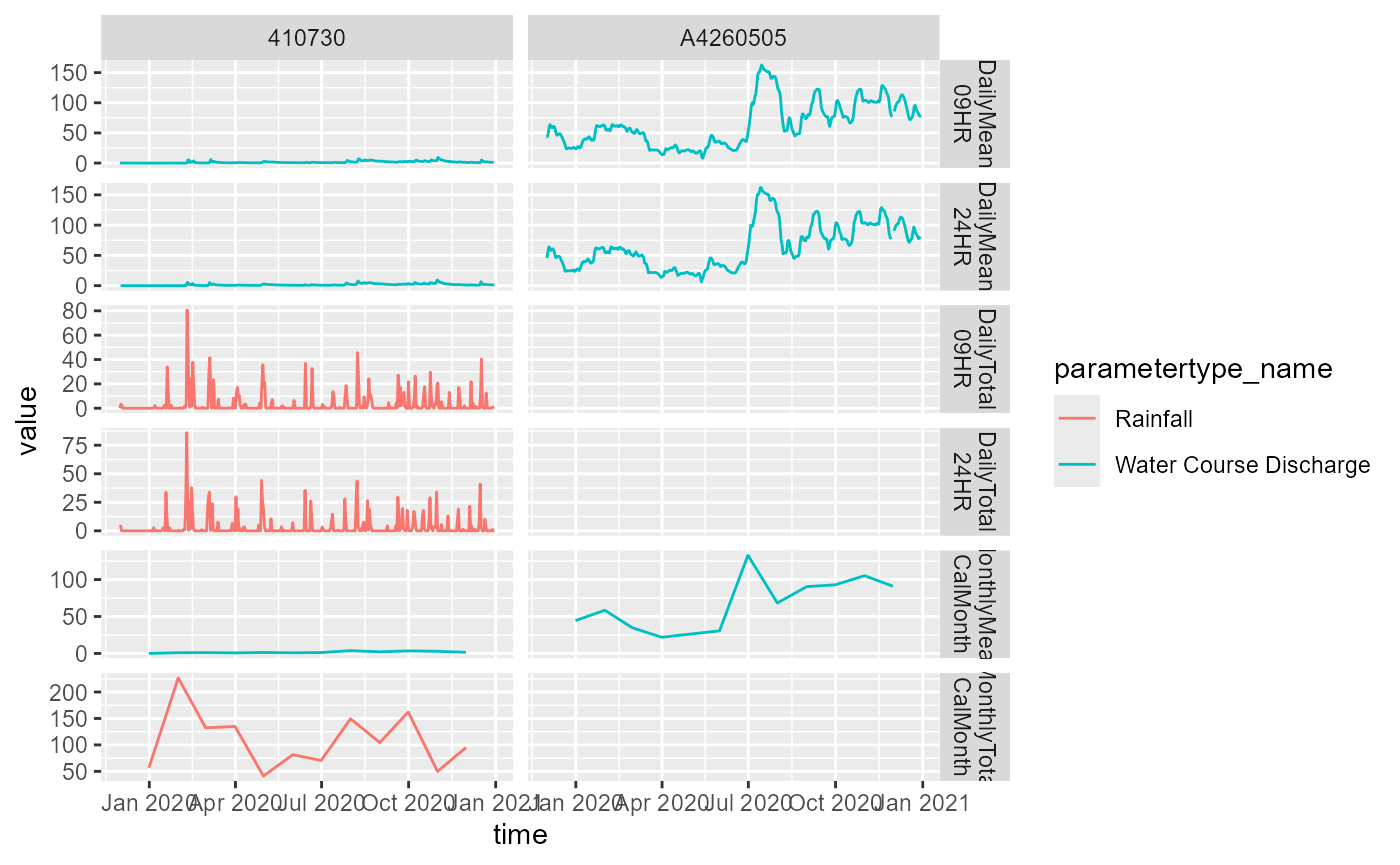
The results here (@ref(fig:multi-var)) exemplify some of the benefits
and pitfalls. We get two Daily Mean and Daily Total results that are
shifted, one at 9am and the other midnight. We do though get Daily and
Monthly aggregations for both discharge and rainfall with one call. We
could clean up the 9/midnight duplication by using
datatype = c('QaQc.*09', 'QaQc.*Month'), but an
illustration was warranted.
multi_ts |>
  dplyr::mutate(ts_name = stringr::str_replace_all(ts_name, '\\.', ' '),
                ts_name = stringr::str_remove_all(ts_name, 'DMQaQc Merged')) |>
  ggplot(aes(x = time, y = value, color = parametertype_name)) +
  geom_line()  +
  facet_grid(ts_name ~ station_no, scales = 'free', labeller = label_wrap_gen(10))
Multiple variables, time periods, and aggregations.
Obtaining ts_ids
The key to pulling KiWIS records is to use either ts_id
or ts_path. The ts_path can theoretically be
constructed on the fly, but it is tricky to generalise and get right.
Instead, we tend to use the ts_id, finding it by regex with
other columns. This is the key to culling the full set of potential
timeseries returned by getTimeseriesList() to a desired set
to pull.
Even if using the base API, looking through the ts_ids for each
gauge, variable, aggregation, etc can be slow and error-prone. Instead,
find_ts_id() gives an interface to search this dataframe,
filtering it according to a set of desired timeseries. This is done
internally to fetch_kiwis_timeseries(), but can also be very useful for
manually searching for available and desired timeseries to pull.
For example, with a pre-check with find_ts_id(), we
would have found the duplication above:
ts_check <- find_ts_id(portal = 'bom',
           gauge = c('410730', 'A4260505'),
           variable = c('discharge', 'Rainfall'),
           units = c('cumec', 'mm'),
           timeunit = c('Daily', 'Monthly'),
           statistic = c('Mean', 'Total'),
           datatype = c('QaQc'))

ts_check |>
  dplyr::select(station_no, ts_id, ts_name, ts_unitname, parametertype_name, everything()) |>
  dplyr::arrange(station_no, parametertype_name, ts_name)
#> # A tibble: 9 × 14
#>   station_no ts_id     ts_name       ts_unitname parametertype_name station_name
#>   <chr>      <chr>     <chr>         <chr>       <chr>              <chr>
#> 1 410730     1555010   DMQaQc.Merge… millimeter  Rainfall           Cotter R. a…
#> 2 410730     1554010   DMQaQc.Merge… millimeter  Rainfall           Cotter R. a…
#> 3 410730     1556010   DMQaQc.Merge… millimeter  Rainfall           Cotter R. a…
#> 4 410730     1572010   DMQaQc.Merge… cubic mete… Water Course Disc… Cotter R. a…
#> 5 410730     1573010   DMQaQc.Merge… cubic mete… Water Course Disc… Cotter R. a…
#> 6 410730     1574010   DMQaQc.Merge… cubic mete… Water Course Disc… Cotter R. a…
#> 7 A4260505   208647010 DMQaQc.Merge… cubic mete… Water Course Disc… River Murra…
#> 8 A4260505   208648010 DMQaQc.Merge… cubic mete… Water Course Disc… River Murra…
#> 9 A4260505   208649010 DMQaQc.Merge… cubic mete… Water Course Disc… River Murra…
#> # ℹ 8 more variables: station_id <chr>, ts_unitsymbol <chr>, ts_path <chr>,
#> #   parametertype_id <chr>, stationparameter_name <chr>, from <chr>, to <chr>,
#> #   database_timezone <chr>
And then we could have determined how we needed to change the request to get a clean call
ts_check_clean <- find_ts_id(portal = 'bom',
           gauge = c('410730', 'A4260505'),
           variable = c('discharge', 'Rainfall'),
           units = c('cumec', 'mm'),
           timeunit = c('Daily', 'Monthly'),
           statistic = c('Mean', 'Total'),
           datatype = c('QaQc.*09', 'QaQc.*Month'))

ts_check_clean |>
  dplyr::select(station_no, ts_id, ts_name, ts_unitname, parametertype_name, everything()) |>
  dplyr::arrange(station_no, parametertype_name, ts_name)
#> # A tibble: 6 × 14
#>   station_no ts_id     ts_name       ts_unitname parametertype_name station_name
#>   <chr>      <chr>     <chr>         <chr>       <chr>              <chr>
#> 1 410730     1555010   DMQaQc.Merge… millimeter  Rainfall           Cotter R. a…
#> 2 410730     1556010   DMQaQc.Merge… millimeter  Rainfall           Cotter R. a…
#> 3 410730     1572010   DMQaQc.Merge… cubic mete… Water Course Disc… Cotter R. a…
#> 4 410730     1574010   DMQaQc.Merge… cubic mete… Water Course Disc… Cotter R. a…
#> 5 A4260505   208647010 DMQaQc.Merge… cubic mete… Water Course Disc… River Murra…
#> 6 A4260505   208649010 DMQaQc.Merge… cubic mete… Water Course Disc… River Murra…
#> # ℹ 8 more variables: station_id <chr>, ts_unitsymbol <chr>, ts_path <chr>,
#> #   parametertype_id <chr>, stationparameter_name <chr>, from <chr>, to <chr>,
#> #   database_timezone <chr>
Large requests
Note: with big pulls, it can be useful to use
find_ts_id() and getTimeseriesValues()
approach, or at least a manual check of find_ts_id() prior
to using fetch_kiwis_timeseries(). In my experience,
there are often errors with some gauges or other issues that mean clean
pulls need some troubleshooting of the variable availability etc. It is
often easiest to find and solve problems if you check what you’re
actually trying to pull.