The fetch_hydstra_timeseries() function wraps
get_variable_list() and get_ts_traces(), which
allows some extra functionality and smoother workflows but also
introduces some danger and sometimes inefficiency. Some argument names
have been changed compared to get_ts_traces() (which uses
the Kisters names nearly verbatim) for more clarity and to move towards
a unified interface across the KiWIS and hydstra API styles.
This function allows requests for the full period of record by
passing 'all' for the start_time and
end_time (or the earliest and latest possible dates,
respectively). The downside of this approach is that the calls to the
API are inefficient (each row is called separately), though this is also
necessarily the case if asking for the period of record manually for
gauges with different periods. It will be possible to do some inferences
and combinations here, but it has not been high priority.
This function is most useful when we want to pull the period of
record of the same variable for a set of gauges. For example, we might
want to pull discharge for the period of record, which we can do by
passing 'all' to start_time and
end_time, yielding @ref(fig:discharge-period).
Period of record
I’ll use the same set of sites as in the core hydstra demonstration, chosen to capture a range of periods of records and available variables.
The Upper Steavenson (405328) only has flow
Barwon (233217) has many variables, but their start dates differ
Taggerty (405331) is no longer in operation- ran 2010-2013
Marysville golf course (405837) is only rainfall
barwon <- '233217'
steavenson <- '405328'
taggerty <- '405331'
golf <- '405837'
discharge_record <- fetch_hydstra_timeseries(portal = 'vic',
                                       gauge = c(barwon, steavenson, taggerty),
                                       var_list = '141',
                                       start_time = 'all',
                                       end_time = 'all',
                                       timeunit = 'day',
                                       statistic = 'mean')
#> Loading required package: foreach
#> Loading required package: future
discharge_record |>
  ggplot(aes(x = time, y = value, color = site_short_name)) +
  geom_line() +
  facet_grid(site_short_name~., scales = 'free_y') +
  labs(y = unique(discharge_record$variable_short_name))
Discharge for the period of record for three gauges.
Multiple data types
We can also pull data for all available variables by passing
'all' to var_list. DANGER: if
var_type = 'all', the same statistic will be applied to all
variables. Calling 'all' for the
start_time and 'end_time' will give
each variable a different period of record if they differ; the times are
found from each row returned by get_variable_list().
For the sake of demonstration, we make the bad choice here of getting all the data, summarised in @tbl-all. This throws a warning because it’s a bad idea in general.
all_vars_fullperiod <- fetch_hydstra_timeseries(portal = 'vic',
                                       gauge = c(barwon, golf),
                                       var_list = 'all',
                                       start_time = 'all',
                                       end_time = 'all',
                                       timeunit = 'day',
                                       statistic = 'mean')
#> Warning: `var_list = 'all'` is *very* dangerous, since it applies the same
#> `statistic` (`data_type` in get_ts_traces), i.e. aggregation function, to all
#> variables, which is rarely appropriate. Check the variables available for your
#> sites and make sure you want to do this.
all_vars_fullperiod |>
  dplyr::summarise(n_records = dplyr::n(),
                   .by = c(site_short_name, variable_short_name, statistic)) |>
knitr::kable()| site_short_name | variable_short_name | statistic | n_records |
|---|---|---|---|
| BARWON @ GEELONG | Water Level (m) | mean | 23345 |
| BARWON @ GEELONG | Field pH | mean | 5326 |
| BARWON @ GEELONG | DO (ppm) | mean | 5326 |
| BARWON @ GEELONG | Temp (°C) | mean | 5326 |
| BARWON @ GEELONG | Turbidity (NTU) | mean | 5326 |
| BARWON @ GEELONG | EC@25C (µS/cm) | mean | 5326 |
| R.G. MARYSVILLE | Rainfall (mm) | mean | 8615 |
We can request different statistics for different variables
if the variables are passed in as a vector of arguments to
var_list, though then you have to know what they are. In
that case, the statistic argument should be a vector of
matched length to var_list.
Let’s ask for the period of record for daily mean discharge, total daily rainfall, and maximum daily temperature in the Barwon (233217), which returns different statistics for each variable (@tbl-diffstats).
different_statistics <- fetch_hydstra_timeseries(portal = 'vic',
                                       gauge = c(barwon, golf),
                                       var_list = c('141', '10', '450'),
                                       start_time = 'all',
                                       end_time = 'all',
                                       timeunit = 'day',
                                       statistic = c('mean', 'tot', 'max'))
different_statistics |>
  dplyr::summarise(n_records = dplyr::n(),
                   .by = c(site_short_name, variable_short_name, statistic)) |>
knitr::kable()| site_short_name | variable_short_name | statistic | n_records |
|---|---|---|---|
| BARWON @ GEELONG | Discharge (ML/d) | mean | 23345 |
| BARWON @ GEELONG | Temp (°C) | max | 5326 |
| R.G. MARYSVILLE | Rainfall (mm) | tot | 8615 |
Regex selection
We can also use the variable and unit
arguments instead of var_list to search for variables by
name, as in fetch_kiwis_timeseries(). This is very experimental, moving
towards a unified wrapper. We can use this to recapitulate the pull of
discharge for the gauges (@ref(fig:discharge-byname)).
by_name <- fetch_hydstra_timeseries(portal = 'vic',
                                       gauge = c(barwon, steavenson, taggerty),
                                       variable = 'discharge',
                                       unit = 'ML/d',
                                       start_time = 'all',
                                       end_time = 'all',
                                       timeunit = 'day',
                                       statistic = 'mean')
by_name |>
  ggplot(aes(x = time, y = value, color = site_short_name)) +
  geom_line() +
  facet_grid(site_short_name~., scales = 'free_y') +
  labs(y = unique(by_name$variable_short_name))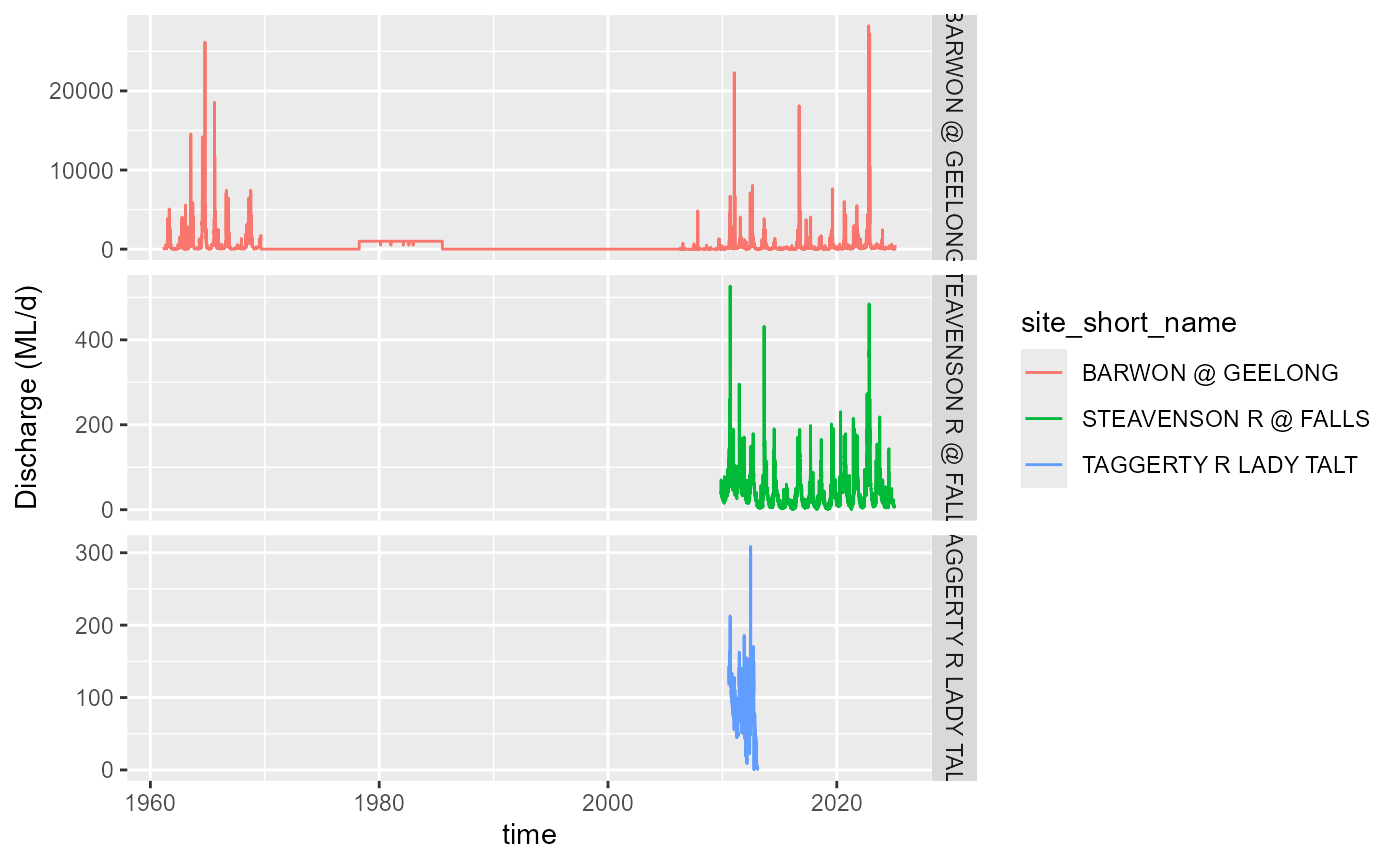
Discharge for the period of record for three gauges, obtained by name.
Large requests
Note: with big pulls, it can be useful to use the bare
get_variable_list() and get_ts_traces()
approach, or at least a manual check of
get_variable_list(). In my experience, there are often
errors with some gauges or other issues that mean clean pulls need some
troubleshooting of the variable availability etc. It is often easiest to
find and solve problems at the low-level API interface. Making
fetch_hydstra_timeseries() incorporate some of this is in
development.